Debugging:
For the tube amp debugging I used a digital multi-meter to verify transistors and diode polarization, as well as DC and bias voltages, a signal generator and an oscilloscope. I have a Velleman PCSGU250 Oscilloscope ($200), it has a signal generator output and a two oscilloscope channels, it connects to a PC via USB and has a simple and easy to use graphical interface, that offers frequency spectrum analysis.
 |
| Fig 1. Velleman PCSGU250 Oscilloscope ($200) |
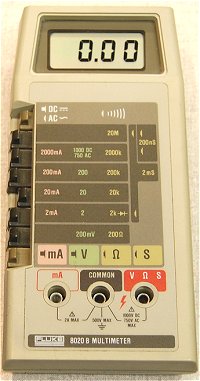
I have a vintage digital multimeter very similar to the first Fluke digital multimeter models, mine is a KT 605 (probably a Fluke copy):
I had many issues with cold soldering and oxidation due to the use of a soldering paste not suitable for electronics, this caused many DC regulators breakdowns. I had to redo many of the soldering joints.
Another issue was related to excessive noise in some of the amps stages, I had to replace some of the amps by followers to reduce the amplification of noise floor.
Film capacitors are very sensitive to high temperature and some of them had to be replaced since they where damaged while soldering. It would be better to use low temperature solder paste (Sn Bi) and hot gun to avoid heating too much capacitor pads.
25W class-D amplifier gain was set with input pins PA_GAIN[1:0]=11 to get a maximum gain of 36dB.
Verification:
Signal generator and an electric guitar were used as input of the tube amp, oscilloscope signal capture at different test points on the board are shown below.
Fig 2. shows the time signal of a G note at the output of the guitar and input of the tube amp, with approximately 0.5V peak-to-peak
 signal at the tube amp input") |
| Fig 2. G note (open 4th string) signal at the tube amp input |
Fig 3. shows the frequency spectrum of the same signal by using the FFT function of the scope.
As it can be seen fundamental frequency of the signal is 196Hz which corresponds to a G note, open 4th string, harmonics at multiples of the fundamental frequency can be observed
 |
| Fig 3. G note frequency spectrum signal |
Fig 4. shows the signal at the output of the preamp first double operational amplifier stage (TP6) (refer to schematics on the
Tube Amp Schematics post), signal is amplified by almost 10, more than 4V peak-to-peak, with no apparent distortion.
 at the output of preamp 1st stage (TP6)") |
| Fig 4. A G note (open 4th string) at the output of preamp 1st stage (TP6) |
Fig 5. shows a G note at the output of the preamp second double operational amplifier stage (TP8). Some distortion appears, with more gain on the positive cycle and some soft clipping. Signal range is around 4V peak-to-peak.
") |
| Fig 5. G note at the output of the preamp second stage (TP8) |
Fig 6. shows a G note at the output of the equalizer (TP21) with bass and treble at 0. Signal range is 1.6V peak-to-peak.
|
| Fig 6. G note at the output of equalizer (TP21). Treble = 0. Bass = 0 |
Fig 7. shows a G note at the output of the equalizer (TP21) with bass at 0 and treble at 10. Signal range is 1.5V peak-to-peak.
. T=10, B = 0") |
| Fig 7. G note at the output of the equalizer (T21). Treble = 10, Bass = 0 |
Fig 8. shows a G note at the output of the equalizer (TP21) with bass at 10 and treble at 0. Signal range is 0.4V peak-to-peak.
 |
| Fig 8. G note at the output of the equalizer (T21). Treble = 0, Bass = 10 |
Fig 9. shows a G note at the output of the output amp first section (TP20). Distortion appears on both cycles with some hard clipping on both cycles. Signal range is around 0.8V peak-to-peak.
") |
| Fig 9. G note at the output of the output amp first section (TP20) |
Fig 10. shows a G note at the output of the output amp second section (TP18). Distortion appears on both cycles with harder clipping in the negative cycles. Signal range is around 0.8V peak-to-peak.
") |
| Fig 10. G note at the output of the output amp second section (TP18) |
Fig 11. shows a G note at the output of the main volume potentiometer (TP22). Signal range is around 0.6V peak-to-peak. Volume = 10
 |
| Fig 11. G note at the output of the main volume potentiometer (TP22). Volume = 10 |
Fig 12. shows a G note at the output of the Speaker Emulator filter first opamp (TP 25). Signal range is around 1.5V peak-to-peak. Mid frequencies are boosted.
") |
| Fig 12. G note at the output of the Speaker Emulator filter first opamp (TP25) |
Fig 13. shows a G note at the output of the Speaker Emulator filter first opamp (TP 29). Signal range is around 1.5V peak-to-peak. Mid frequencies are boosted.
") |
| Fig 13. G note at the output of the Speaker Emulator filter second opamp (TP29) |
Fig 14. shows a G note at the output of the Speaker Emulator filter third opamp (TP 24). Signal range is around 1.75V peak-to-peak. Mid frequencies are boosted.
") |
| Fig 14. G note at the output of the Speaker Emulator filter third opamp (TP24) |
Fig 15. shows a G note at the output of the Speaker Emulator filter fourth opamp (TP 27). Signal range is around 1.6V peak-to-peak. Mid frequencies are boosted.
") |
| Fig 15. G note at the output of the Speaker Emulator filter fourth opamp (TP27) |
The real signals correspond quite accurately to LTSpice simulation results.
Now is time for the sound tests, but first of all I needed a Speaker cabinet to connect to the 8ohms power amplifier output.
. Treble = 0. Bass = 0")
No comments:
Post a Comment